How many urban agriculture sites are there in Los Angeles County? Where are they located?
In LA County, various organizations map and list the occurrences of specific agricultural activities in the region, but no one (so far) had aggregated all agricultural activities into a single extensive database.
We found this lack of information surprising, and thought a comprehensive data set would be of great value to enable the general public to take advantage of nearby urban agriculture, and to allow public officials to enact informed policies pertaining to agriculture in urban LA.
We focused the study on four typologies – school gardens, community gardens, farms, and nurseries – and compiled a first-of-its-kind database containing all of these four agriculture types within urban LA County.
Research
Aerial Scanning
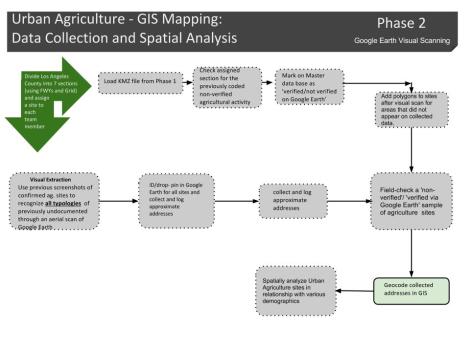
The methodology for each typology varied slightly, but all followed a similar process. First, we uncovered all available inventory lists for each type of agriculture site. Then, we placed phone calls (over 3,000 of them!) to each of the sites from the list. We then geocoded the addresses of the confirmed sites into Google Earth as a KMZ file, and aerially/visually confirmed the existence of the sites.
Maps
The primary goal of this project was to create a map of all the urban agriculture locations in Los Angeles County according to the four typologies. We created an interactive map, where visitors can search for agriculture sites by location, name, or typology. Additionally, visitors can contribute sites they know exist or have been removed. Urban agriculture is largely an ephemeral activity and we welcome participation from other researchers, practitioners, advocates, and fans of urban agriculture.
Findings
In total, our team verified 1,261 urban agriculture sites in LA County. School gardens accounted for the most urban agriculture sites, as 761 were verified in the County. Additionally, the team verified 211 nurseries, 171 farms and 118 community gardens.
Agricultural Density Index
We created an “agriculture index” for each city or unincorporated area in LA County which measured the number of urban ag sites per square mile. The higher the index, the greater concentration of urban agriculture in that jurisdiction.
This table shows the ten jurisdictions with the greatest concentration of urban agriculture sites
Florence-Graham, Lawndale, and East LA have that highest indices in LA County.
Demographic Analysis
We analyzed demographic factors at the jurisdiction level and conducted a spatial analysis for density, income, and race/ethnicity to see if there was a correlation between any of these factors and agriculture density (the “index”).
The chart above shows this relationship, with the larger bubbles representative of population size.
The only finding was a positive correlation between density of urban agriculture and population density. So, basically, on average dense cities were likelier to have a greater concentration than non-dense cities. This appeared counter-intuitive at first, but school gardens comprised about 60% of urban ag sites found in this study, and cities with a greater concentration of people will also have a greater concentration of schools, and therefore more school gardens.
This was the only relationship discovered. Race and income had no correlation to urban agriculture.


